Google Analytics 4 is the next generation of Google Analytics. For the first time ever, Google has rebuilt it’s platform from the ground up, transforming how data is collected to deliver holistic measurement across websites and mobile apps.
Unlike previous upgrade iterations, GA4 is a brand-new product. This means starting afresh, with a new learning curve to navigate.
In this guide, we’ll cover everything you need to know about GA4, including how it differs from UA, why you should use it, and how to get started. We’ll also delve into some of the platform’s new reporting features to demonstrate how it can help you learn more about user behavior.
What is Google Analytics 4 (and why should you make the move)?
Google Analytics 4 is the rebuilt, rebranded and expanded version of the App + Web property rolled out by Google in 2019. It promises to be the future of analytics, with cross-platform tracking, AI-driven data, and privacy-centric design.
Its features and capabilities are built to help you not only better understand users, but predict behavior to improve user experience.
How GA4 differs from Universal Analytics
When Google officially announced the launch of GA4, they said:
“The new Google Analytics will give you the essential insights you need to be ready for what’s next.”
The big changes are designed to help you “get ready for what’s next”, as opposed to solely reacting to what’s already happened.
Here’s how:
1. A model based on users and events
The focus in GA4 is very much on users, with each interaction labeled as an event.
This means sessions and pageviews are now events. For instance, a page_view event contains the parameters page_location, page_referrer, and page_title.
The change benefits marketers by allowing accurate tracking of user journeys across the web and mobile apps. In the old model, tracking is bound to URLs and interactions are grouped by time frame.
The new event-driven data model makes cross-referencing insights easier. It also improves pathing analysis by letting you see how users navigate your website and/or app.
For example, every time someone signs up for your newsletter, a generate_lead event is sent to GA4. By setting that as an end event you can use pathing analysis to identify what users are doing before they hit subscribe. Their behavior can be used to predict future activity and tailor your site or app to encourage more sign-ups.
Events in GA4 are grouped into four categories:
Automatically collected events. Events that are automatically tracked after installing the GA4 base code. These include initial actions, such as page_view, session_start, and first_visit.Enhanced measurement events. Automatically collected events such as scrolls, site search, video engagement, and outbound clicks that can be enabled or disabled to suit your website or app. These allow you to go deeper than page views to measure user behavior and content success.Recommended events. Events that Google recommends you set up based on your industry. For example, recommended events for ecommerce stores include add_to_cart, purchase, and begin_checkout.Custom events. Events and parameters that you can set up yourself depending on your needs. For example, if you run an ecommerce store, you might decide to set up an error event after begin_checkout to see what users do when they face an error. Their activity can then be used to improve your checkout process
Aside from custom events, GA4 can log the majority of relevant events automatically without the need to configure them separately using the global site tag (gtag.js) or Google Tag Manager.
2. Machine learning replaces cookies
With the introduction of GDPR laws in Europe and enhanced privacy online, it’s becoming more difficult to track users with cookies. As a result, third-party cookies are being phased out. Firefox and Safari already block them by default. By 2023, Google plans to do the same.
With machine learning, GA4 makes the need for cookies obsolete. Google’s AI-powered insights automatically alert you to product data trends. It also gives you access to predictive metrics to help identify users and actions that may lead to a purchase. These are:
Purchase probability: The probability of a user who was active in the last 28 days making a purchase in the next seven days.Churn probability: The probability of a user who was active in the last seven days not being active in the next seven days.
3. Revenue prediction: The predicted revenue from purchases in the next 28 days from users active in the previous 28 days.
Using this data, you can anticipate customer actions and tailor marketing campaigns to focus on high-value audiences.
3. Improved debugging
Debugging in UA can make it hard to pinpoint whether an issue is related to Google Tag Manager or your website.
GA4 helps users overcome these challenges by introducing a live debugging report called DebugView in the interface. This lets you monitor event data in real-time, as well as custom parameters, and set user properties.
You can also isolate and see user data from devices that have debug enabled. And, if you use the Google Tag Manager Chrome extension you can import data directly to DebugView in real-time to quickly find issues.
4. Free BigQuery connection
BigQuery allows large and complex data sets to be queried quickly and easily, removing the issue of sampling that’s common when creating complex segments in GA.
Until now, this feature has only been available for GA360 users. But with GA4, all users can benefit from exporting raw events data to perform queries and export to an external tool.
5. New layout
The GA4 user interface is the most immediately apparent change. Navigation structure has been streamlined to focus on user paths and events in line with the new data collection model.
GA4 interface:
Universal Analytics interface:
Visualization is improved and data tables have been updated. It’s now easier to get a holistic view of real-time data at a glance:
You also have the opportunity to interact with data dynamically and add comparisons. For example, you can compare data generated by desktop devices with data generated by mobile devices, or all recent user activity vs. recent user activity from a specific country:
It’s a stark change from UA that may take some getting used to. Once you’re familiar with GA4’s new data model, the new layout makes it easy to view and predict user behavior.
Why you should begin collecting data with GA4 right away (even though it’s not all systems go)
To be clear, Universal Analytics isn’t going anywhere just yet. As Bud Hennekes explains in his post for CXL:
“GA4 is, at the very least, months away from becoming the default Google Analytics platform.”
But GA4 is the future of analytics, and with cookies being phased out, now is a good time to start using it to collect data and familiarize yourself with its capabilities.
GA4 is also forward-facing only. It can only collect data from the moment of creation and data cannot be retroactively pulled from UA.
Setting it up now will aid machine learning and AI in accurately predicting user probability, making data more meaningful when you eventually make the full switch.
How to set up Google Analytics 4: A simple no-nonsense guide
Google has created a Setup Assistant to make the process of setting up a GA4 property alongside your existing Universal Analytics as pain-free as possible.
Here’s how it’s done:
The basics
1. Log in to your Google Analytics Account
2. Click the gear icon (Admin) in the bottom left navigation
3. Under Property, check that the correct account is selected and click GA4 Setup Assistant
4. Click Get Started under I want to create a new Google Analytics 4 property
5. If your site uses gtag.js, you can decide whether you want the Google wizard to enable data collection using your existing tags.
If you use a website builder or CMS (e.g. WordPress, Wix, Squarespace, Shopify, etc.), Google Tag Manager, or if your site is tagged with analytics.js, you’ll see a message notifying you that you’ll need to install new tags on your site.
Google’s guide to adding a GA4 property provides instructions on how to do this.
6. Click Create property
Using the details from your UA property, Google will connect your existing analytics with GA4 to set up your new property. It will also activate enhanced measurement so you can immediately start learning more about user behavior. All of this is done alongside your existing UA data, allowing you to keep tracking data in your existing setup.
7. From the GA4 Property Setup Assistant Page, click See your GA4 property to go to a new Setup Assistant for configuration.
Google offers the following customizations here:
Tag installation: Add global site tags to collect event data in your new property.Custom event measurement: Add events that aren’t covered by automatic and enhanced measurement. For example, you may want to track form submissions or clicks on specific call-to-action links.User ID: Assign unique user IDs to site visitors to be able to track them across platforms and devices. Enhanced measurement: Enable default events to utilize the power of Google’s AI.Activate Google signals: Switch on cross-device reporting and demographic data from users who use Ad Personalization.Link to Google Ads: Connect GA4 to your Google Ads account to track ad data.Link to BigQuery: Connect GA4 to BigQuery database to export and query analytics data.Define Audiences: Segment users into audiences for reporting and analytics purposes. For example, you may decide to group users from a particular location, or by an action like clicking through to your site via a Facebook post. You can then use these audiences to create location-specific or remarketing ad campaigns.Set up conversions: Create custom conversions to assign value to important interactions (e.g. file_download, Form_submit, or News_letter_sign_up).Implement ecommerce measurement: Set up measurement for ecommerce-specific events. For example, select_promotion when a user clicks on a promotion banner, or add_to_cart when a user adds an item to their cart. Manage users: Manage access to your GA4 property. This is useful if you need to grant access to a member of your team.
Adding a new data stream
GA4’s Setup Assistant will automatically create a data stream for your website during set-up. To add additional streams for iOS and Android apps and Web:
1. Go to Admin > Data Streams, then click Add Stream
2. Click iOS app, Android app, or Web
3. If you’re adding an app data stream, enter your iOS bundle ID or Android package name, then click Register app. Follow the instructions to download the config file and add the Firebase SDK to your app, then run it to verify installation before clicking Finish. If you’re adding a Web data stream, enter your primary URL, enable enhanced measurement, then click Create stream.
Set up conversions and event tracking
Using the Setup Assistant will help you measure common events and track them as conversions.
You can also manage conversions and events manually in the “Events” report. From here, all existing events can be easily tracked as conversions by toggling the switch under Mark as conversion. The results will then be shown in the “Conversions” report.
If you want to create a new event to track a specific page, you’ll need to click on Create Event in the “Events” report.
For example, if you want to track users viewing a thank-you page, you can configure an event with page_location as the parameter and thank_you as the value.
When a user views that page, it will show up as an event in your report. From there you can mark it as a conversion.
Finally, you can track events and conversions by using a GA4 event tag in Google Tag Manager. This can be useful if you want to track a specific action such as a button click.
To do this, you’ll first need to configure GTM.
Configure Google Tag Manager
Google Tag Manager supports GA4 properties with two tags:
Google Analytics: GA4 ConfigurationGoogle Analytics: GA4 Event
Setting up the GA4 Configuration tag
The Google Analytics: GA4 Configuration tag should be fired on every page you want to collect GA4 property data on. It will also need to be fired before you set up an event.
Here’s how to set it up in GTM:
Click Tags > NewClick Tag ConfigurationSelect Google Analytics: GA4 ConfigurationEnter your measurement ID. This can be copied from Admin > Data Streams in Google Analytics.
In Fields to Set, add any parameters you’d like to configure. For best results, Google suggests using recommended event parameter names.In User Properties, add any custom user properties you want to configure. Some user properties are automatically logged in analytics, but you can add up to 25 additional properties per GA4 property.
In Advanced Settings, set a Tag Firing Property or use Tag Sequencing if you want Configuration tags to fire before any event tags that require it.Click Triggering and select the triggers that cause the tag to fire. For example, “All Pages” would set the configuration tag to fire on every page of your site.Save the tag configuration and publish your container.
Setting up a GA4 Event tag
GA4 event tags won’t always be needed. For example, if you currently use UA tags to track events that can be collected using the new Enhanced Measurement feature, you should use that option instead.
The time to add a tag is when you need more detail than Enhanced Measurement can provide. Google gives the following example:
“If you want to collect more detailed scroll depth data than what is provided via enhanced measurement, you can trigger a Google Analytics 4 Event tag to fire based on Tag Manager’s scroll depth trigger.”
Here’s how to set up a GA4 Event tag in GTM:
Click Tags and then NewClick Tag ConfigurationSelect Google Analytics: GA4 EventUnder Configuration Tag, use the Configuration Tag you created earlierUnder Event Name, enter the name of your event (Google suggests using the recommended event names for best results)Under Event Parameters, enter your parameter name and value )Google suggests choosing from the recommended parameter names for best results)Add your custom user propertiesIn Advanced Settings, set a Tag Firing Property, or use Tag Sequencing if you want Configuration tags to fire before any event tags that require itClick Triggering and select the triggers that cause the tag to fire(e.g. if your event was “purchase” the trigger would be when a user has completed their purchase)Save the tag configuration and publish your container
Turn on Debug Mode
Turning on Debug mode is the final step in validating your analytics configuration. It’s an important one too, as Ken Williams explains:
“Without Debug Mode, GA4 will batch your events together and send across the network in bundles (which is part of the reason you shouldn’t use a proxy), but when Debug Mode is running your data will be sent immediately as you run tests on your app. Also, data captured while Debug Mode is running will be filtered out of your other reports so that it does not artificially inflate your metrics (in other words, no more separate GA properties for production and staging).”
Debug mode is enabled differently for your website and apps.
Enabling debug mode on your website
Switching on debugging for website events is as simple as installing the Google Analytics Debugger Chrome extension and enabling it.
Enabling debug mobile on your iOS app
To activate debugging for iOS, Google’s official documentation provides the following instructions:
To enable Analytics Debug mode on your development device, specify the following command line argument in Xcode:
-FIRDebugEnabled
This behavior persists until you explicitly disable Debug mode by specifying the following command line argument:
-FIRDebugDisabled
Enabling debug mobile on your Android app
To activate debugging for Android, Google provides the following instructions:
To enable Analytics Debug mode on an Android device, execute the following commands:
adb shell setprop debug.firebase.analytics.app package_name
This behavior persists until you explicitly disable Debug mode by executing the following command:
adb shell setprop debug.firebase.analytics.app .none.
5 GA4 reports to get the best marketing insights
Earlier we touched on how GA4’s events-based model and machine learning are used to improve reports to give you a more complete look at user behavior.
Now let’s look at ways you can use these reports to enhance your marketing.
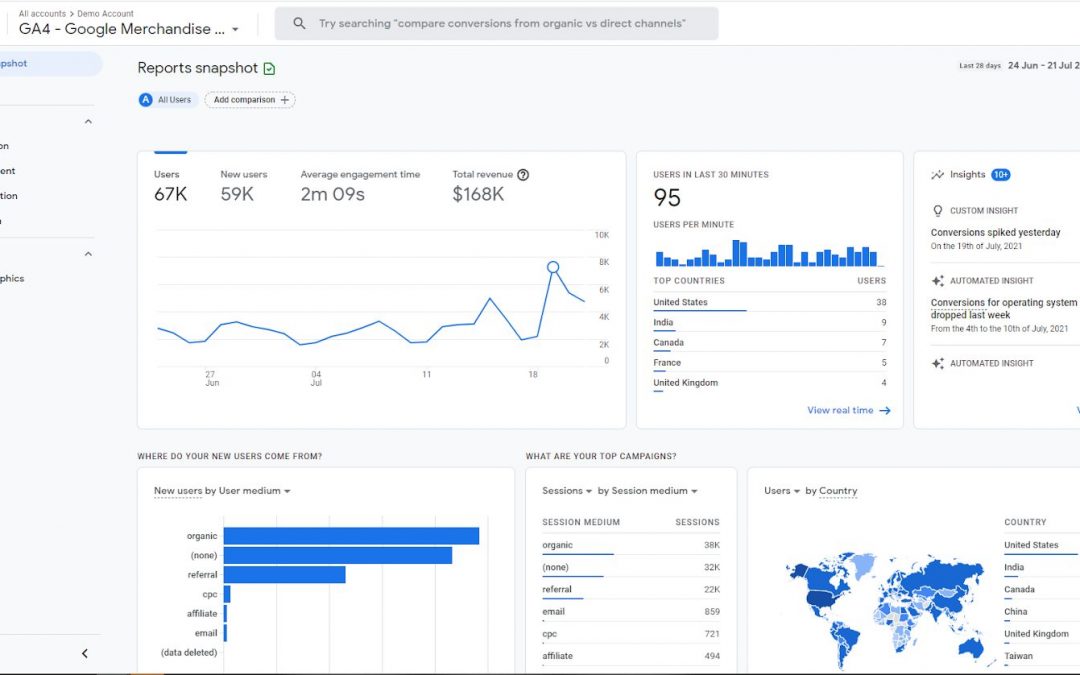
1. Reports snapshot
The reports snapshot is the first page you see after logging in to GA4. This summarizes key areas of your website: traffic, engagement, conversions, and revenue. If you’re tracking metrics for mobile, “Firebase” will provide similar stats for your apps.
Use snapshots to quickly view top campaigns, pages, and traffic sources. And to ensure that everything is functioning correctly from an aerial viewpoint.
2. Real-time
The real-time report shows you events in the last 30 minutes. This is useful for traffic activity after a recent product launch.
For example, if you’ve just released a new blog post, video, or product, real-time will let you quickly analyze how it’s performing.
You can also run up to five comparisons to see how segments are performing side-by-side in real-time:
This is a change from UA, where side-by-side comparisons aren’t available in real-time reports. It also means you no longer have to keep adding filters to view performance.
As well as comparisons (which are available across all reports), Real-time lets you “View user snapshot”. This follows the user journey for a random user and reports on all events that occurred:
Use this to get an idea of how users are interacting with your website or app in real-time, including where they’re from and which actions they’re taking.
3. Life cycle
Life cycle reports follow the traditional conversion funnel:
AcquisitionEngagementMonetizationRetention
These reports will quickly let you see how users enter your conversion funnel and how they behave once they do.
For example, you can use acquisition reports to see which channels are driving new customers. Engagement and retention reports can then be used to understand customer actions and whether they continue to engage with you after converting.
Use this data to answer questions such as:
When did a user last engage?When did a user last make a purchase?Which traffic sources deliver users with the highest lifetime value?Which campaigns deliver the best lifetime value?
4. Demographics and Technology
The “User” section has a lot of the same data you’ll find in the “Audience” section of UA. The reports can be used in the same way to identify demographic majorities, niche demographics, and failing demographics:
Say you run a fitness brand and demographics data shows your majority audience is females under 30 who are interested in fitness. This information can be used to populate your website and app with images of females under 30 in workout gear to increase relevancy and engagement.
Demographics can also be used to spot gaps in the market for a particular audience. For instance, females over 65 that enjoy working out at the gym. You can then target them with personalized content and products that help performance.
You can also leverage User reports to spot underperforming demographics. For example, you may identify that younger users aren’t interested in high-ticket products. Or older generations prefer to make purchases over the phone. Data can then be used to improve accessibility or make tweaks to move away from those audiences.
5. The Analysis Hub
The Analysis Hub is perhaps the most significant feature introduced for marketers in GA4. Here you’ll find a collection of advanced analytics that go beyond standard reports to help you take a deep dive into customer behavior.
Here’s Google’s overview of what’s possible:
Quickly perform ad hoc queriesEasily configure and switch between techniquesSort, refactor, and drill down into the dataUse filters and segments to focus on the data that’s most relevant to youCreate segments and audiencesShare your explorations with other users of the same Google Analytics propertyExport the exploration data for use in other tools
From the Analysis Hub you can run six techniques:
Exploration. The most common way to analyze data. Different visualization styles let you present your data in bar charts, pie charts, line charts, and geo maps, making it easier to present analysis to clients in a way that makes sense. Cohort analysis. Analyze a group of users with a common characteristic (e.g. an event or conversion). For example, you could generate a cohort report for how long it takes users to convert after reading a sales page and analyze their behavior in comparison to other users. Funnel analysis. Visualize steps users take to complete an event. For example, identifying what users do before signing up for your course lets you see how well they are succeeding or failing. The information can then be used to tweak your content or funnel. Path analysis. Visualize the events stream in the form of a tree graph to see the paths users take on your site or app. This analysis helps you identify top pages users click on after landing on your site or app, looping behavior that may indicate users are getting stuck, and the effects events have on subsequent user actions. Segment overlap. Analyze how different user segments relate to each other. This technique can be used to uncover new segments of users on your site. For example, you may create segments for new users, purchasers, and mobile traffic to view the overlap between the three and analyze how many new users are buying products on mobile. User lifetime. Visualize how users behave during their lifetime as a customer. Here you can find out which sources or campaigns are driving users with the highest lifetime revenue in a particular month, which campaigns are acquiring valuable customers, and when users last purchased from your site or engaged with your app.
How to create new analysis
1. Click on Explore in the left navigation menu to launch Explorations:
2. If you know the kind of technique you want to explore, use a predefined template to get started quickly. If not, click + to create a blank template:
Within the Analysis Hub interface, you’ll find segments, dimensions, and metrics in the left column. These are the audience, events, and numbers you want to analyze.
In the right column, you can select the type of visualization and the values you want to display as columns in the report.
Data is visualized on the right of the screen. From here you can add up to 10 additional tabs and click on data points to interact further with your data.
Google breaks down how to find your way around in its guide to getting started with Explorations.
Conclusion
While Google Analytics 4 isn’t fully realized, now is the time to begin exploring what it has to offer.
By rolling it out gradually, Google is giving marketers the chance to get familiar with new features and begin collecting historical data.
Set up dual-tagging on your website and app to run GA4 alongside Universal Analytics. This will let you use UA until GA4 is fully equipped with everything you need.
It will also help you grow your audiences on the new platform so that they’re viable for digital marketing and advertising when you eventually make the switch.
The post The Definitive Guide to Google Analytics 4 appeared first on CXL.